Savings Drawdown Calculator

See how long your savings last under regular withdrawals, or the amount you can sustain for N years.

100% Browser-Based Local Processing
%
%

Inflation is applied to the withdrawal, not to the growth — so the amount you take rises each year to buy the same things, which is what makes the pot run out sooner than a flat withdrawal suggests. Real markets do not return a fixed percentage, and a bad run early in drawdown does disproportionate damage because you are selling to fund each payment. Tax on withdrawals is not modelled. Not financial advice.

The pot lasts

19 yr 4 mo

Total taken585,000
Final year's withdrawal3,120
Growth earned185,000
Never-depleting amount1,333
Formula and working

The formula

Each month: pot = (pot − withdrawal) × (1 + growth ÷ 12); the withdrawal rises with inflation each year

Your numbers

Waiting for your numbers.

An estimate, not financial advice. Figures are indicative, and the assumptions behind them are stated on the tool itself. Tax rules, rates and fees vary by country and change over time — check against your provider or a qualified adviser before acting on a number.

Privacy Focused

🔒 Local Processing. Your salary and balances never leave your device.

Instant Results

🌐 Fully Client-Side. Runs instantly in your browser.

No Signup

⚡ No accounts. No API keys. Just open and use.

Browser Based

🚀 No installs, no sign-ups, no bank account linking.

What is a Savings Drawdown Calculator?

A Savings Drawdown Calculator shows how long a pot lasts as you withdraw from it. Each period, balance = balance × (1 + r) − withdrawal, where r is the period growth rate. If growth covers your withdrawals the pot lasts indefinitely; otherwise it shows the year it runs out.

This calculator answers the question at the heart of retirement planning: how long will my money last if I keep drawing from it? — and the flip side, how much can I safely withdraw to make it last a set number of years?

The logic is transparent. Each period, your balance earns growth and then you take a withdrawal: balance = balance × (1 + r) − withdrawal, where *r* is the growth rate for that period. Repeat until the pot is exhausted — or, if the growth on your balance is at least as big as your withdrawals, it lasts indefinitely and the tool tells you so. Turn on inflation and your withdrawals rise each year to hold their real spending power, which is more realistic (and shortens how long the pot lasts).

How to work out how long your savings last

Step 1: Choose a mode. "How long will it last?" or "What can I withdraw for N years?"

Choose a mode. "How long will it last?" or "What can I withdraw for N years?"

Step 2: Enter your pot and withdrawal. Starting balance, and the amount you take (monthly or annual)

Enter your pot and withdrawal. Starting balance, and the amount you take (monthly or annual).

Step 3: Set growth (and inflation). An assumed annual return, and optionally an inflation rate to grow withdrawals

Set growth (and inflation). An assumed annual return, and optionally an inflation rate to grow withdrawals.

Step 4: Add a target (mode 2). The number of years you want the money to last

Add a target (mode 2). The number of years you want the money to last.

Step 5: Read the result and schedule. Years it lasts (or "never runs out"), or the sustainable withdrawal, plus the year-by-year table

Copy any figure.

Savings Drawdown Calculator in action

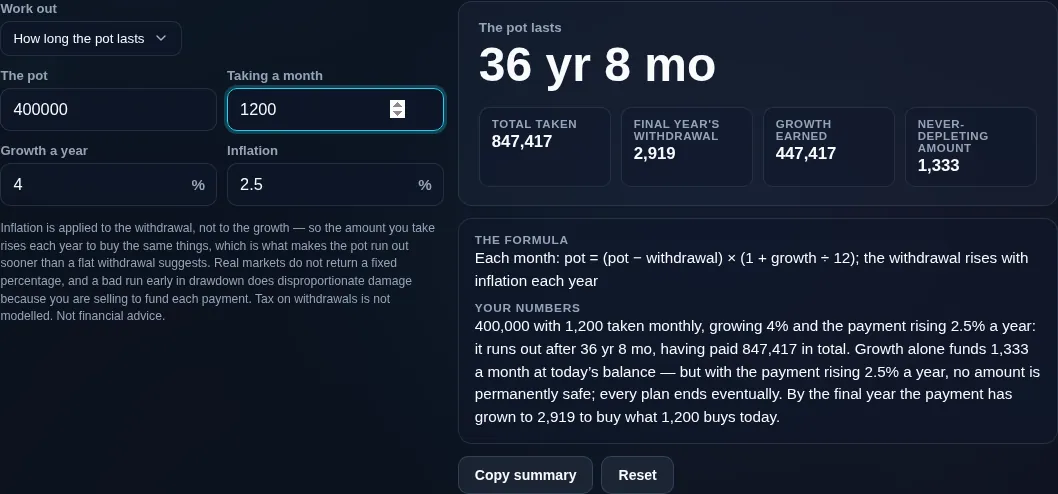
Savings drawdown calculator showing how long a pot lasts when the withdrawal rises with inflation each year rather than staying flat
How long a pot lasts at a withdrawal that rises with inflation
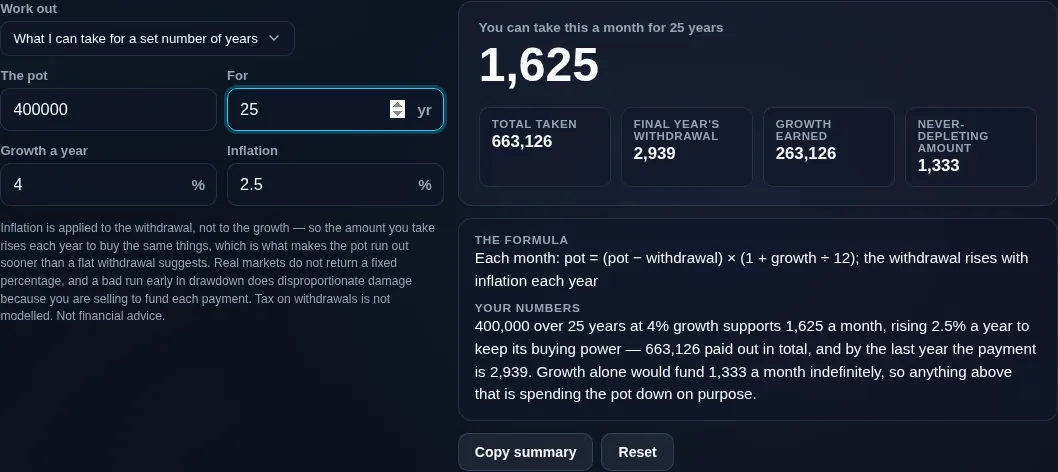
Savings drawdown calculator solving for the withdrawal that makes a pot last a set number of years
The second mode — what can be taken to make the pot last a set number of years
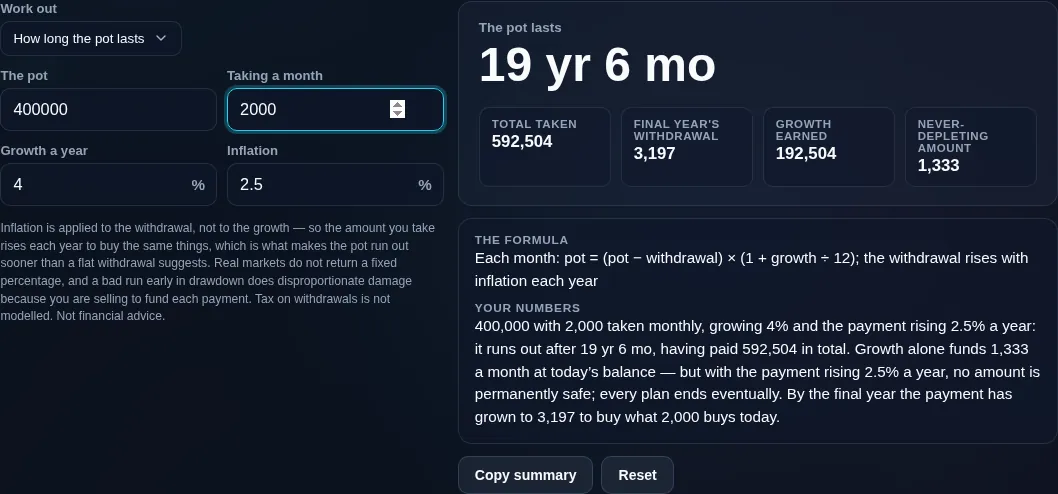
Savings drawdown calculator showing the never-depleting withdrawal beside the one being taken, which is the line the whole question sits either side of
The withdrawal the pot would sustain indefinitely, beside the one being taken
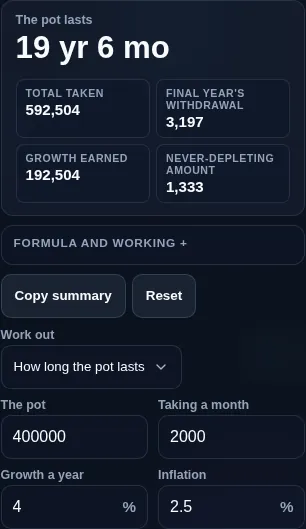
Savings drawdown calculator running in a phone browser with the mode selector at the top
Mobile browser

When a drawdown calculator helps

Enter your starting balance, a regular withdrawal (monthly or annual), an assumed growth rate, and optionally an inflation rate. In the second mode, enter a target number of years and the tool solves for the sustainable withdrawal. You get the result, a year-by-year schedule (start balance, growth, withdrawal, end balance), and the total withdrawn.

Two honest points matter here. First, this uses a single, constant return — real markets don't. Sequence-of-returns risk means a run of poor returns early in retirement can drain a pot much faster than a flat average suggests, even if the long-run average is the same. Second, the well-known "4% rule" is a rule of thumb from historical studies, not a guarantee — your own safe rate depends on your horizon, mix of assets, and luck. These figures are an estimate, not financial or retirement advice, and they exclude tax on withdrawals.

For fixed guaranteed-style income, compare the Annuity Calculator; for reaching the pot in the first place, the FIRE Calculator. Everything runs privately in your browser.

  • Retirement longevity. Will the pot outlast you at your spending level?
  • Setting a withdrawal. Find a rate that lasts your target years.
  • Stress-testing inflation. See how rising costs shorten the pot.
  • Early-retirement bridge. How long savings cover you before a pension starts.
  • Reality-checking the 4% rule against your own numbers.

Realistic example. A $500,000 pot, growing 4% a year, withdrawing $30,000 a year, lasts about 23 years before running out. Raise growth to 6% and it lasts much longer; add inflation and it lasts less.

Advanced tip. Try a lower growth rate than the long-run average to build in a safety margin against sequence risk.

Common mistake to avoid. Don't assume a flat average is safe. A bad first few years can deplete a pot faster than the average implies.

Related. For fixed lifetime income instead of flexible drawdown, see the Annuity Calculator.

What to keep in mind

  • Fixed-return estimate. It assumes one constant growth rate; real returns vary year to year.
  • Sequence-of-returns risk. Poor returns early can drain a pot faster than a flat average suggests.
  • The 4% rule is a rule of thumb. Historical, not guaranteed; your safe rate depends on your situation.
  • Tax excluded. Withdrawals may be taxable depending on the account and your country.
  • Not financial or retirement advice, and private. A calculator only — and all math runs on your device, nothing uploaded.
Frequently Asked Questions

How long will my savings last?

Enter your starting balance, your regular withdrawal, and an assumed growth rate. Each period, the tool applies growth then subtracts your withdrawal, repeating until the pot runs out. For example, $500,000 growing 4% a year while you withdraw $30,000 lasts about 23 years. If growth on the balance covers your withdrawals, it lasts indefinitely and the tool says so.

---

How much can I safely withdraw each year?

Use the second mode: enter your balance, growth rate, and a target number of years, and the tool solves for the withdrawal that lasts exactly that long. It's essentially the annuity payout math applied to your pot. Remember it assumes a constant return — a genuinely "safe" amount usually means withdrawing a bit less to allow for bad years.

---

What is the 4% rule, and is it reliable?

The 4% rule is a rule of thumb from historical studies suggesting you can withdraw about 4% of your pot in year one, then adjust for inflation, and have it last roughly 30 years. It's a useful starting point, not a guarantee — it depends on your asset mix, horizon, fees, and market luck. Treat it as a benchmark to test, not a promise.

---

How does inflation change my drawdown?

With inflation switched on, your withdrawals rise each year so they keep the same real spending power. That means you take more money out over time, so the pot depletes faster than with flat withdrawals. This is the more realistic view for retirement, since your cost of living generally rises. The schedule shows the growing withdrawal each year.

---

What growth rate should I assume?

Use a realistic, ideally conservative, long-run return for how your savings are invested — cash, bonds, and stocks differ widely. A higher assumed rate makes the pot look like it lasts much longer, so it's safer to under-estimate. Because this tool uses one constant rate, building in a margin helps guard against years that come in below average.

---

What is sequence-of-returns risk?

It's the risk that the *order* of returns hurts you, not just the average. If poor returns hit early in retirement while you're withdrawing, you sell more of a shrunken pot and it may never recover — even if the long-run average is fine. A flat-average calculator like this can't show that, which is why a conservative rate and some buffer are wise.

---

Can my savings last forever?

Yes, in principle — if the growth on your balance is at least as large as your withdrawals, the pot never falls, so it lasts indefinitely. Roughly, that happens when your withdrawal is less than balance × growth rate. The tool detects this and tells you the money doesn't run out, rather than showing a depletion year.

---

Does this account for tax on withdrawals?

No. It calculates the pre-tax drawdown from your pot. Depending on the type of account and your country, withdrawals may be taxable, which reduces your spendable income and effectively shortens how long the money lasts. Factor your own tax situation in separately, or reduce the growth rate slightly as a rough allowance.

---

Is this the same as an annuity?

No. Drawdown means you keep your pot invested and withdraw flexibly, with the balance rising or falling — you keep control and any leftover, but you carry the risk it runs out. An annuity trades a lump sum for a fixed income, usually for life, removing that risk but giving up control. Compare the fixed-income side with the Annuity Calculator.

---

Can I withdraw monthly?

Yes. Set the withdrawal frequency to monthly and the tool applies growth and withdrawals each month (using a monthly growth rate), which better matches how most people actually spend in retirement. The result is shown in years and months, with an annual schedule for readability.

---

Is this financial advice?

No. This calculator runs standard drawdown arithmetic on the numbers you enter — it doesn't recommend a withdrawal rate, an investment mix, or whether to draw down at all. Results are estimates on a fixed return and exclude tax and market volatility. For retirement decisions, consult a qualified financial professional.

---

Is my data uploaded, and does it work offline?

No upload, and yes it works offline. Every calculation runs entirely in your browser, so your balance and withdrawals are never sent to a server, there's no account, and no tracking. Once the page has loaded it keeps working with no connection — good for private retirement planning you'd rather keep to yourself.

Still have questions?

If you can't find the answer you're looking for, feel free to contact our support team.

Contact Us