Stock Average Calculator

Find your average cost per share across multiple buys, plus break-even and profit/loss.

100% Browser-Based Local Processing
Your buys

Buying more at a lower price lowers your average cost — it also makes the position bigger, so it does not undo a loss and it raises what you have at stake if the price keeps falling. This is arithmetic on the trades you enter, not a recommendation to buy. Selling fees and capital gains tax are not included in the break-even.

Average cost per share

38.26

Total shares 160
Total invested 6,122.00
Value now 5,760.00
Unrealised −362.00
Formula and working

The formula

Average cost = total invested ÷ total shares

Your numbers

6,122.00 over 160 shares is 38.26 each.

An estimate, not financial advice. Figures are indicative, and the assumptions behind them are stated on the tool itself. Tax rules, rates and fees vary by country and change over time — check against your provider or a qualified adviser before acting on a number.

Privacy Focused

🔒 Local Processing. Your salary and balances never leave your device.

Instant Results

🌐 Fully Client-Side. Runs instantly in your browser.

No Signup

⚡ No accounts. No API keys. Just open and use.

Browser Based

🚀 No installs, no sign-ups, no bank account linking.

What is a Stock Average Calculator?

A Stock Average Calculator finds your average cost per share across several purchases: average cost = total amount invested ÷ total shares. Add each buy (shares and price), and it shows your average, total shares, and break-even. Averaging down lowers your average but also increases your position and risk.

When you buy the same stock more than once at different prices, your average cost per share — your cost basis — is what matters for tracking profit and loss and knowing your break-even. This calculator works it out across as many purchases as you like, using a simple, transparent formula: average cost = total amount invested ÷ total shares (that is, the sum of shares × price, plus any fees, divided by the total number of shares).

Add each buy — the number of shares and the price you paid — and optionally your brokerage fees. The tool shows your total shares, total invested, and average cost per share. Enter a current price too and it adds your current value, unrealized profit or loss, and your break-even price (the price you'd need to sell at to get your money back, before selling costs and tax). There's also a mode to work out how many shares to buy at today's price to move your average to a target level.
How to calculate your average share price

Step 1: Add your first buy. Enter the number of shares and the price per share

Add your first buy. Enter the number of shares and the price per share.

Step 2: Add more buys. Repeat for each purchase at different prices; include fees if you want them counted

Add more buys. Repeat for each purchase at different prices; include fees if you want them counted.

Step 3: Read your average. See total shares, total invested, and the average cost per share, with the formula

Read your average. See total shares, total invested, and the average cost per share, with the formula.

Step 4: Optional: enter the current price. To see current value, unrealized profit/loss, and your break-even

Optional: enter the current price. To see current value, unrealized profit/loss, and your break-even.

Step 5: Optional: reach a target average. Enter a target and current price to find how many more shares it takes

Copy any figure.

Stock Average Calculator in action

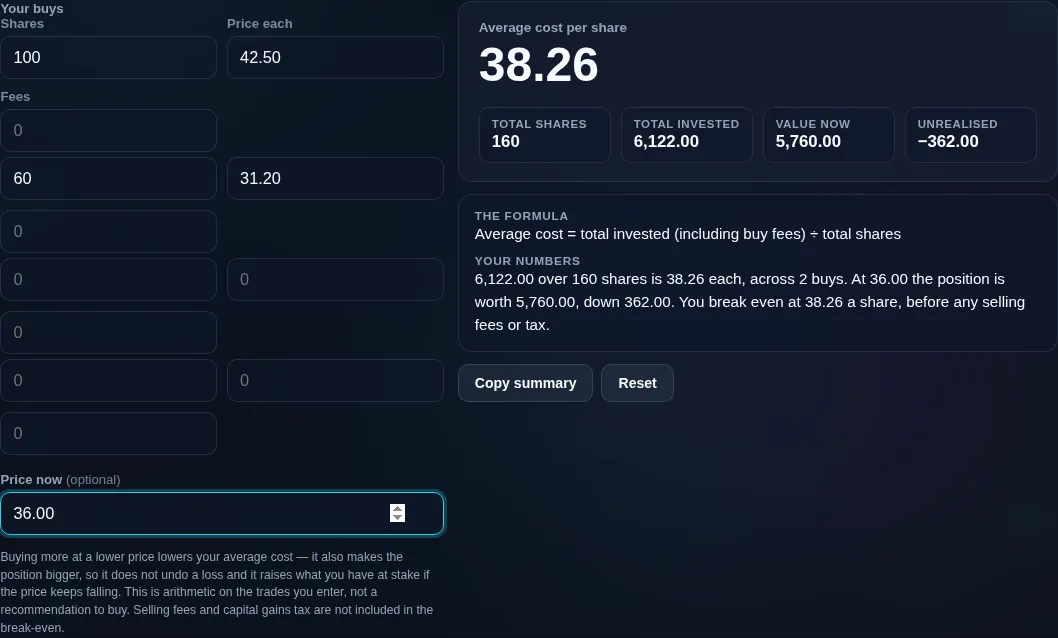
Stock average calculator averaging two buys into one cost per share, with the unrealised gain or loss against the current price
Two buys averaged, with the unrealised position against the price now
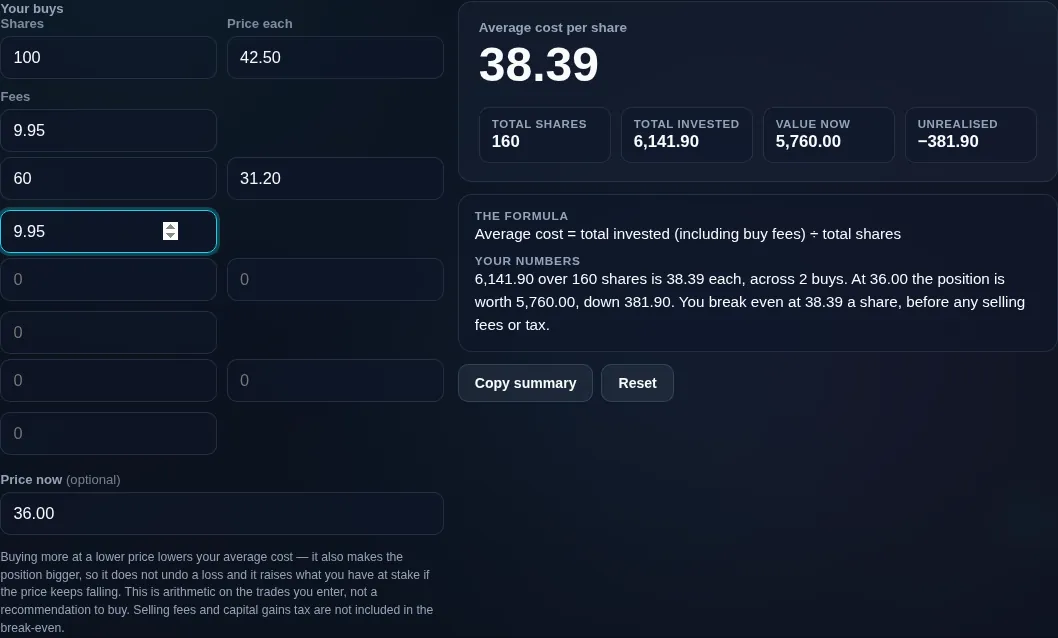
Stock average calculator with buy fees included in the cost basis, raising the average cost and the break-even price with it
Buy fees folded into the basis, so the break-even moves with them
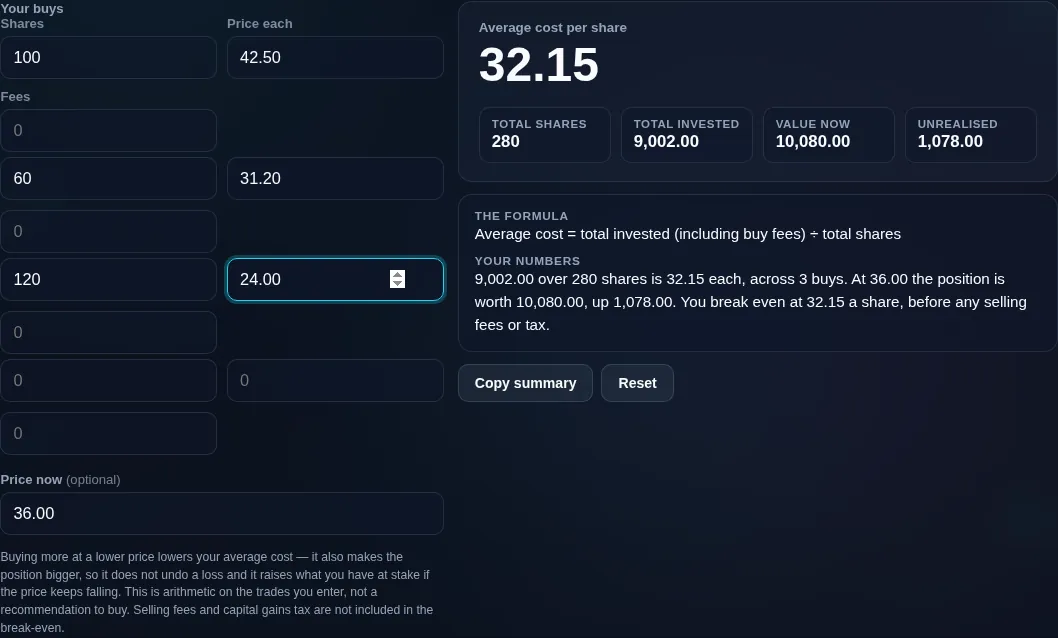
Stock average calculator after a third buy at a lower price, showing the average fall while the total invested rises
A third buy at a lower price, lowering the average and enlarging the position
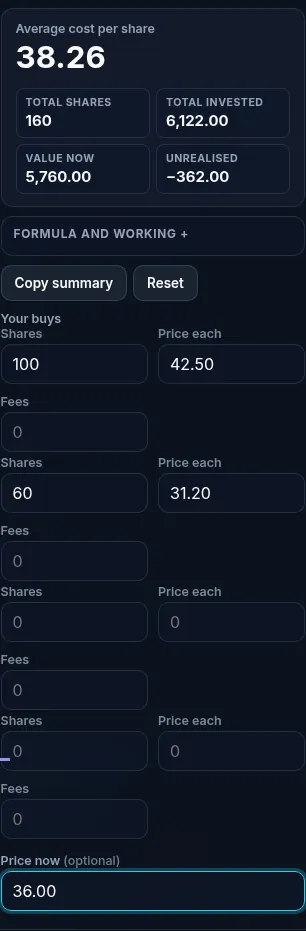
Stock average calculator running in a phone browser with the buy rows stacked
Mobile browser

When a stock average calculator helps

One honest point worth stressing: "averaging down" — buying more as the price falls — lowers your average cost, but it isn't a way to fix a loss. It increases your position in a stock that's dropping, so if it keeps falling you lose more, not less. Lowering your average can *feel* like progress, but it's adding risk and money to a losing bet. This tool just does the arithmetic on your entries; it's not advice and not a signal to buy more. Averaging down should be a deliberate decision based on your view of the stock, not a reflex to make a red number look better.

Fees and taxes also matter: buying fees raise your basis, and when you sell, selling costs and capital gains tax reduce your net — see the Capital Gains Tax Calculator. Everything runs privately in your browser; nothing is uploaded.

  • Tracking cost basis. Keep an accurate average across multiple buys.
  • Break-even. Know the price you need to get back to even.
  • Averaging decisions. See how a further buy changes your average — with eyes open on the risk.
  • Reach a target average. Work out the shares needed to hit a chosen average.
  • Crypto too. The same maths works for any asset bought in tranches.

Realistic example. You buy 100 shares at $50 ($5,000), then 100 more at $30 ($3,000). Total: 200 shares for $8,000, so average cost = 8,000 ÷ 200 = $40. If the price is now $35, you're down $5/share (−$1,000 unrealized), and you'd break even at $40.

Advanced tip. Use the reach-target mode before averaging down: seeing how many shares (and how much money) it takes to move your average makes the added commitment concrete.

Common mistake to avoid. Don't average down just to lower the number on screen. It increases your stake in a falling stock — decide based on the investment, not the optics.

Related. For the tax when you sell, see the Capital Gains Tax Calculator.

What to keep in mind

  • Averaging down isn't a fix. It lowers your average but increases your position and risk in a falling stock — it's a decision, not a reflex.
  • Not investment advice. The tool does arithmetic on your entries; it doesn't recommend buying or selling.
  • Fees and taxes count. Buying fees raise your basis; selling fees and capital gains tax reduce your net — factor them in.
  • Break-even ignores selling costs and tax. Your real break-even to keep money is a little higher.
  • Currency-agnostic and private. Works in any currency for stocks or crypto, and all maths runs on your device — nothing uploaded.

Frequently Asked Questions

How do I calculate my average share price?

Divide the total you invested by the total shares you own: average cost = total amount invested ÷ total shares. Add up (shares × price) for each purchase, plus any fees, then divide by the total number of shares. For example, 100 shares at $50 and 100 at $30 is $8,000 for 200 shares, an average of $40. The tool does this across all your buys.

---

What is averaging down?

Averaging down means buying more of a stock after its price has fallen, which lowers your average cost per share. If you bought at $50 and buy more at $30, your average drops toward $30. It's a common tactic, but it's important to understand it increases your position in a declining stock — it lowers the average, not necessarily the risk.

---

Is averaging down a good idea?

It depends entirely on the stock, and it's not automatically wise. Averaging down lowers your average cost, but it also puts more money into something that's falling — if it keeps dropping, you lose more. It only makes sense if you have a genuine reason to believe the stock is undervalued, not as a reflex to make a loss look smaller. This tool does the maths; it doesn't advise you to average down.

---

How many shares do I need to buy to reach a target average?

Use the reach-target mode: enter your desired average and the current price, and the tool works out how many shares to buy. The maths solves total invested ÷ total shares = target for the new shares. For example, moving 200 shares averaging $40 down to $35 by buying at $30 requires a specific number of additional shares — and seeing how much money that takes is a useful reality check before you commit.

---

What is my break-even price?

Your break-even price is your average cost per share — the price you'd need to sell at to recover what you put in. If your average is $40, you break even at $40, ignoring costs. In reality, selling fees and any capital gains tax mean you need a slightly higher price to truly get your money back; the tool shows the pre-cost break-even.

---

Do brokerage fees change my average cost?

Yes. Buying fees and commissions add to what you paid, so they raise your total invested and therefore your average cost per share. Including them gives a more accurate cost basis, which matters for your true break-even and for capital gains when you sell. The tool lets you enter fees per trade so your average reflects the real cost.

---

What's the difference between averaging down and dollar-cost averaging?

Dollar-cost averaging is investing a fixed amount at regular intervals regardless of price — a disciplined, planned strategy that smooths your entry over time. Averaging down is specifically buying more *because* the price dropped, often reactively. Dollar-cost averaging is a routine; averaging down is a decision about a falling stock. They can look similar on paper but come from different mindsets.

---

Does this calculate unrealized profit or loss?

Yes, if you enter the current price. Unrealized profit or loss = (current price − average cost) × total shares. It's "unrealized" because you haven't sold, so it's on paper and can still change. For example, 200 shares at a $40 average, now worth $35, shows an unrealized loss of $1,000. The tool displays this alongside your break-even.

---

Can I use this for crypto or mutual funds?

Yes. The average-cost maths is identical for any asset bought in multiple lots — stocks, crypto, ETFs, or mutual fund units. Just enter the units and prices for each purchase. For crypto trades where you also want profit-and-loss including fees on a sale, the Crypto Profit Calculator is a good companion.

---

Does this account for taxes when I sell?

No. This tool works out your average cost, break-even, and unrealized profit or loss, but it doesn't calculate the tax you'd owe when you actually sell. Capital gains tax varies by country, holding period, and your income, and it reduces your net proceeds. For that, use the Capital Gains Tax Calculator with your own rate.

---

Is this financial advice?

No. This calculator simply does arithmetic on the purchases you enter — it computes your average cost and break-even, nothing more. It isn't financial or investment advice, and it doesn't recommend buying, selling, or averaging down. For guidance on your investments, consult a qualified professional.

---

Is my data uploaded, and does it work offline?

No upload, and yes it works offline. Every calculation runs entirely in your browser, so your trade details are never sent to a server, there's no account, and no tracking. Once the page has loaded it keeps working with no connection — handy for private holdings you'd rather not enter into an online broker tool.

Still have questions?

If you can't find the answer you're looking for, feel free to contact our support team.

Contact Us