Investing Calculators

Free investing calculators — dividend reinvestment vs cash, average cost per share, crypto profit after fees, and annuity value or payout.

100% Browser-Based Local Processing

An estimate, not financial advice. Figures are indicative, and the assumptions behind them are stated on the tool itself. Tax rules, rates and fees vary by country and change over time — check against your provider or a qualified adviser before acting on a number.

Privacy Focused

🔒 Local Processing. Your salary and balances never leave your device.

Instant Results

🌐 Fully Client-Side. Runs instantly in your browser.

No Signup

⚡ No accounts. No API keys. Just open and use.

Browser Based

🚀 No installs, no sign-ups, no bank account linking.

What are the Investing Calculators?

Randomly’s investing calculators work out what a position actually cost and what an assumption actually produces: average cost per share across several buys, dividend reinvestment measured against taking the cash, crypto profit and break-even net of fees on both sides, and an annuity’s value or payout. Each shows its formula and runs in your browser.

Four calculators for questions about money already invested, rather than money being borrowed or budgeted. Two are about what you paid — the average cost of a position built over several buys, and the profit on a trade once fees on both sides are counted. Two are about what an assumption compounds into over time.

The figures you type here — what you hold, what you paid, what you expect — are exactly what portfolio trackers ask you to hand over, usually by connecting a brokerage account. These are ordinary web pages: the arithmetic happens here and nothing is uploaded or kept.

They are also explicit that a projection is an assumption dressed as a number. A yield and a growth rate are inputs, not forecasts, and the pages say so beside the result rather than in a footnote.
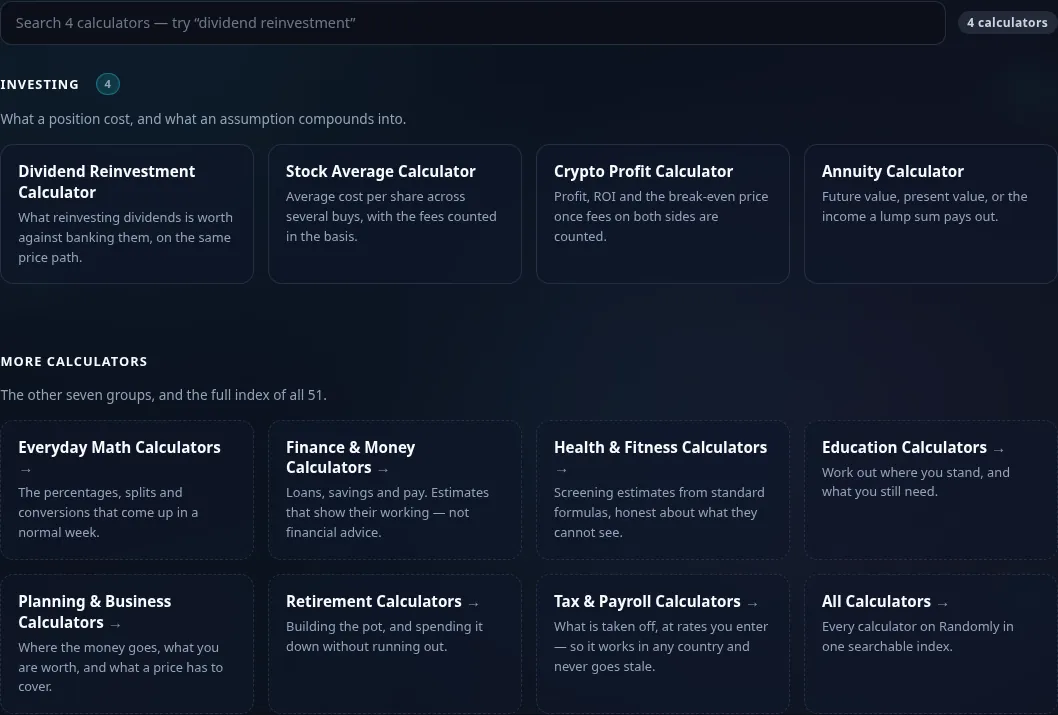
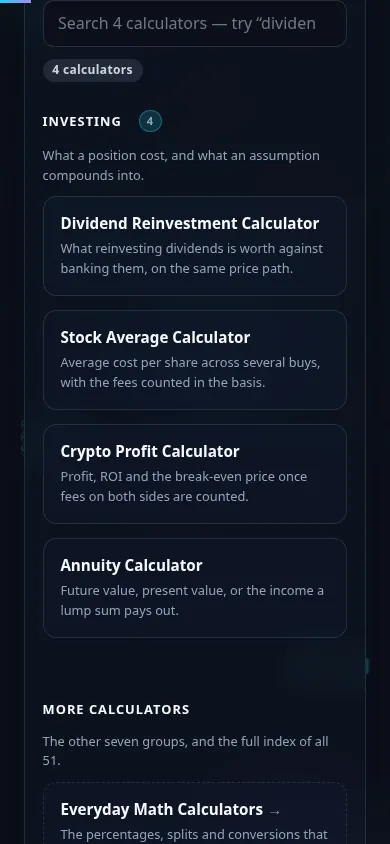
Investing Calculators in action

The Investing calculator grid on Randomly in dark mode — 4 cards: Dividend Reinvestment, Stock Average, Crypto Profit, Annuity
Tool grid (4 calculators)
The Investing calculators on a phone, the 4 cards stacked in a single column
Mobile (stacked grid)

Good to know

  • Fees are counted where they actually land. A buy fee belongs in the cost basis and a sell fee comes off the proceeds, so the break-even price is above what you paid — the figure most profit calculators leave out.
  • Reinvesting is measured against the alternative. The dividend tool runs the same price and dividend path twice, once reinvested and once taken as cash, so the difference is the decision rather than the share.
  • The awkward inputs are answered, not hidden. A zero interest rate, a zero dividend, a wiped-out position — each has a real answer, and each one is given.
  • Nothing is uploaded. No brokerage connection, no account, no storage. Close the tab and the figures are gone.

Frequently Asked Questions

What investing calculators are in this group?

Four: Dividend Reinvestment, Stock Average, Crypto Profit and Annuity. Between them they cover what a position cost, what a trade made after fees, what reinvesting dividends is worth against taking them, and what a stream of payments is worth or produces.

How is average cost per share calculated?

Total invested divided by total shares, where total invested includes the buy fees. Fees belong in the basis because they are part of what the shares cost you — which means your break-even price is slightly above the simple weighted average of the prices you paid. A calculator that lists fees separately reports a break-even you cannot actually break even at.

Does averaging down fix a loss?

No. Buying more at a lower price lowers your average cost, which reads like progress, but it does so by making the position bigger — so it increases what is at stake if the price keeps falling. The calculator does the arithmetic on the trades you enter and takes no view on whether you should make them.

Why is my crypto break-even price higher than what I paid?

Because fees are charged on both sides. If you pay 0.25% buying and 0.25% selling, selling at exactly what you paid leaves you down roughly half a percent. The break-even figure solves for the sell price where proceeds after the sell fee equal your cost including the buy fee, which is the price you actually need.

Is dividend reinvestment really worth more than taking the cash?

Usually, over long periods, because reinvested dividends buy shares that themselves pay dividends. The calculator shows the size of that difference for your assumptions rather than asserting it: it runs the identical price and dividend path twice, changing only whether the dividend is reinvested or banked, so the gap is attributable to the decision alone.

Are dividends taxed if I reinvest them?

In a taxable account, generally yes — a reinvested dividend is normally still income in the year it is paid, even though you never saw the cash. Tax rules vary by country and account type and are not modelled here, so treat the projection as a pre-tax figure and check your own position.

What is the difference between an ordinary annuity and an annuity due?

When the payment falls. An ordinary annuity pays at the end of each period; an annuity due pays at the start, so every payment earns one extra period of growth. The whole future value is multiplied by one plus the periodic rate, and a payout is divided by it. Over twenty years the difference is easily thousands, which is why it is a toggle rather than an assumption.

What happens if I enter a 0% rate?

You get the right answer rather than an error. All three annuity formulas divide by the rate, so at zero they are mathematically undefined — but the limit is simple: a future value becomes the payments added up, and a payout becomes the pot divided by the number of periods. Each mode has that case written out explicitly.

Are these projections predictions?

No. Every figure here is arithmetic on assumptions you supplied. Real returns vary year to year, dividends get cut, and crypto in particular is volatile enough that a straight-line projection says very little about any actual outcome. Use them to compare scenarios and understand the mechanics, not to forecast.

Is any of this investment advice?

No. These are math tools. They do not know your circumstances, your tax position, your time horizon or your tolerance for loss, and they take no view on any security. Speak to a qualified professional before making an investment decision.

Still have questions?

If you can't find the answer you're looking for, feel free to contact our support team.

Contact Us